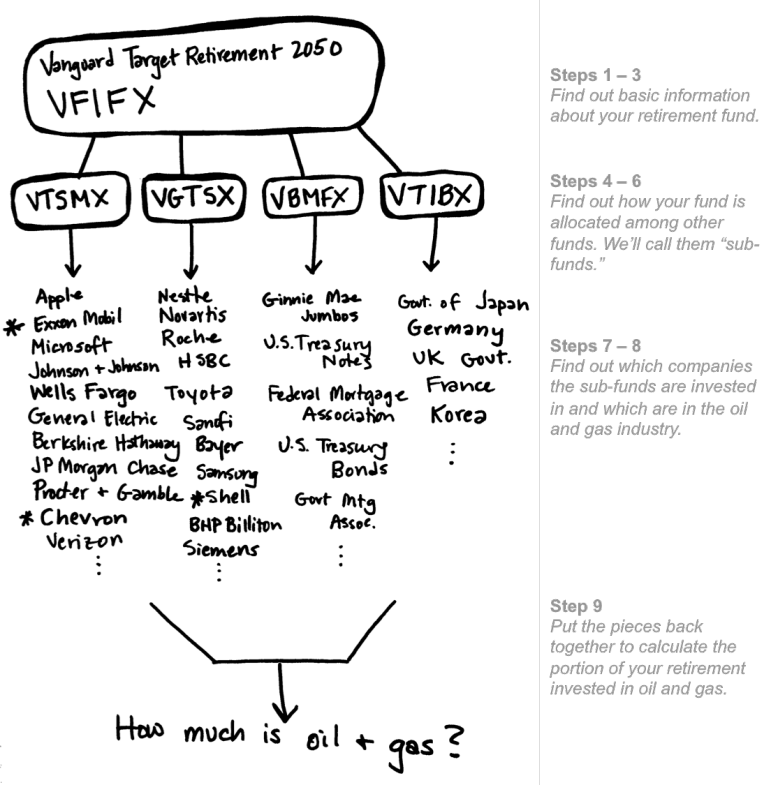
Do you want to find out how much of your retirement fund is invested in oil and gas? You can see Inside Energy’s deep dive into a retirement account in this radio story and this animated data visualization. Retirement funds tend to mirror the stock market: Right now 7.4 percent of S&P 500 companies are in the oil and gas industry, so your 401(k)s, 403(b)s, IRAs or pension is probably similar. For most people, oil and gas investments represent between 5 and 10 percent of their retirement. But every fund is different, and its investment blend is changing constantly.
Here’s how to dig into your retirement account to find out which oil and gas companies are getting your money and how much they are getting.
Step 1. Find the name of your retirement fund
Step 2: Look up your fund’s stock ticker symbol
Step 3: Find some basic information about your fund on Morningstar (optional)
Step 4: Find your fund’s most recent quarterly statement (N-Q) on the SEC website
Step 5: From the N-Q, find a list of your fund’s holdings – we’ll call them “sub-funds”
Step 6: Find the stock ticker symbols for each of your sub-funds
Step 7: Find each sub-fund’s N-Q on the SEC website
Step 8: Find out what portion of each sub-fund is invested in oil and gas companies
Step 9: Add all the sub-funds back together to get your overall oil and gas investment
This method isn’t perfect (or easy), but it will teach you a lot about your retirement fund. Inside Energy used this method to examine Dan Boyce’s retirement account for a recent story, and our analysis closely matched that of a professional financial adviser.
We’ve created a handy Excel spreadsheet template to help you stay organized as you go through these steps. Here is the version ready for you to use. And here’s the completed version for the example we use throughout this guide.
Some preliminary advice
Every fund is different, so you may encounter some confusing road blocks. If you get stuck, try calling the customer service branch of your retirement fund manager (i.e. Fidelity, Vanguard, T. Rowe Price). They should also be able to provide a list of holdings for any fund. If it’s in a format you cannot easily put into a spreadsheet—like a PDF—ask if they have it as a text file. You can also try visiting the fund manager’s website and searching for information about the funds.
Step 1. Find the name of your retirement fund
Whether your money is invested with a 401(k) administrator like TIAA-CREF, T. Rowe Price or Vanguard, or with a brokerage or wealth management firm like Merrill Lynch, Morgan Stanley or JP Morgan Chase, you should be able to find out the names of all the different funds where your money is invested.
If you have an online account for your retirement fund, this information will be on your dashboard. For example, here’s what a Milliman dashboard looks like, and where to find the name of the fund:
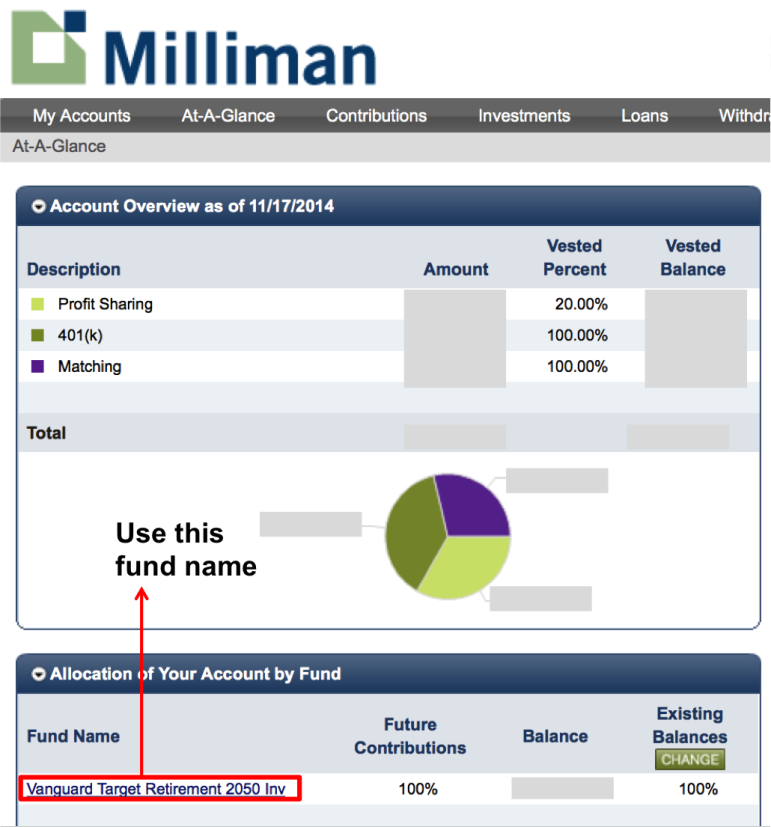
In this example, the fund’s name is Vanguard Target Retirement 2050 Inv. This fund has a target retirement date, which is a popular way of structuring investments.
A few notes:
- Your money might be split between multiple funds. In that case, write down the names of all of them, and the portion of your money each one has.
- If you don’t know how to access your account information online, call your retirement fund’s customer service branch and ask for this information.
- If your retirement fund is set up through your employer, your human resources representative can help you find this information.
Step 2: Look up your fund’s stock ticker symbol
The fund you are invested in typically has a stock symbol, just like Twitter (TWTR) or Wal-Mart (WMT) or any company publicly traded on the stock market.
To find your fund’s symbol, simply Google it. It will generally be five capital letters.
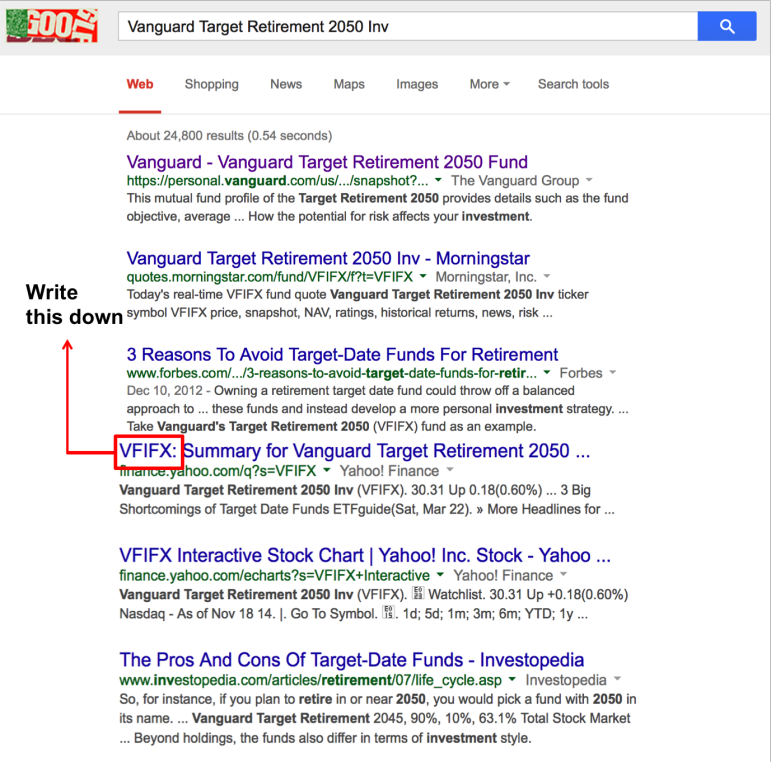
Our example fund, Vanguard Target Retirement 2050 Inv, has the ticker symbol VFIFX.
You can use this symbol to find information about your fund through the U.S. Securities and Exchange Commission (SEC) and through third-party financial sites like Morningstar — it’s also easier to write down and remember than the full fund name.
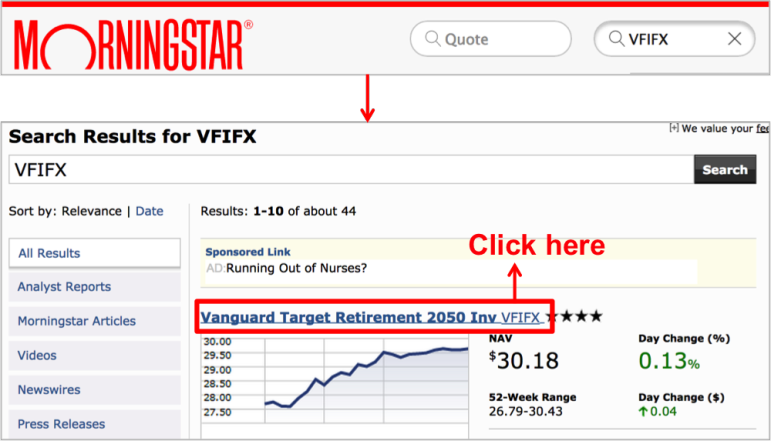
Step 3: Find some basic information about your fund on Morningstar
Because people are obsessed with analyzing the stock market, there are lots of services and sites out there that we can use to find more information. Let’s see what a common one, Morningstar, has to say about your fund.
First, enter the symbol you found in step 2 into the search box at the top of the screen. Click on the name of the fund at the top of the search results to view its profile, which shows basic information like how much the fund is worth right now and its recent performance.
Scroll down to the “Top Sectors” section and click on “More…” Now, in the “Sector Weightings” section you can see how the fund’s stocks are invested by industry, including energy.
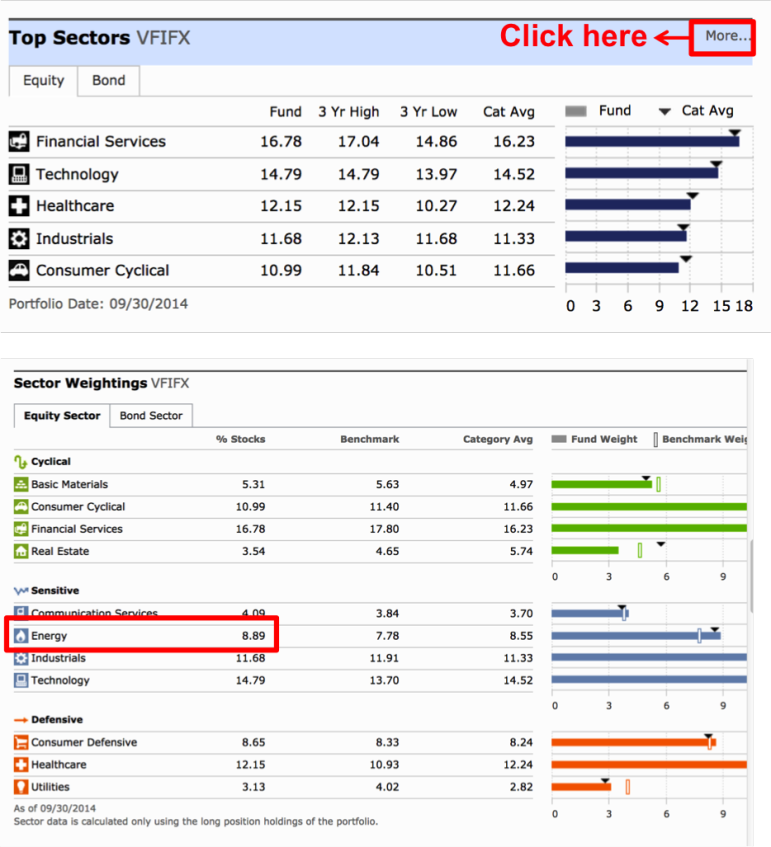
For the example Vanguard fund, 8.89 percent of its stock is in the energy sector
But this doesn’t give us the full picture of how much money is invested in oil and gas: It only shows stocks, not bonds; and the energy sector includes wind, solar, and other types of energy in addition to oil and gas.
To figure out how much of the fund is invested in oil and gas — and in which companies — we need to keep digging.
Step 4: Find your fund’s most recent quarterly statement (N-Q) on the SEC website
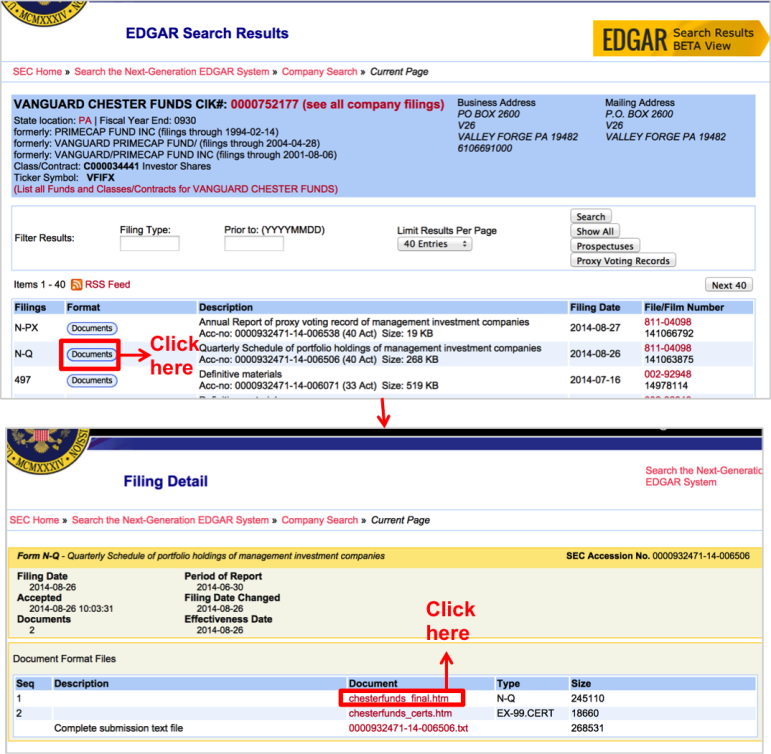
Now we’re ready to see what information your funds report to the U.S. Securities and Exchange Commission, or SEC, which regulates investing. Visit SEC.gov, click on “Company Filings” at the top right of the homepage, and enter your fund’s stock symbol (e.g. VFIFX) in the “Fast Search” box. This takes you to a list of all the documents the fund files with the SEC.
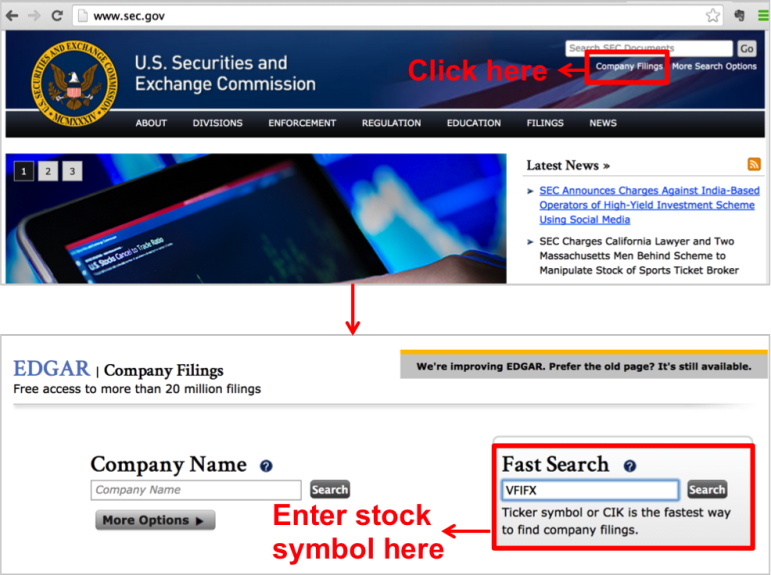
The one we want is called an N-Q, a quarterly report of the fund’s holdings. ‘Holdings’ mean everything a fund invests in.
Click on the “Documents” button next to the most recent N-Q, then click on the first link in the “Document” list: It will look like sometitle.htm and have type N-Q.
In the sample fund, VFIFX, it is called chesterfunds_final.htm.
Step 5: From the N-Q, find a list of your fund’s holdings – we’ll call them “sub-funds”
The N-Q contains a list of all the entities in which your retirement fund invests. For a retirement fund, this will generally be a list of mutual funds your retirement operator (in this case, Vanguard) manages. We’ll be referring to those as “sub-funds.” The N-Q will also say how those investments are allocated: what percent of the money is in each sub-fund.
The N-Q may contain information about multiple top-level funds, so you’ll need to find the section that describes yours. Tip: An easy way to do this is to do a search on the file — using ctrl+F or command+F — for your fund’s name.
The sample Vanguard fund, VFIFX, is invested in five different sub-funds. Your fund could be invested in a lot more. The T. Rowe Price Fund we looked at in another story, TRRNX, is invested in 19 different funds.
Look at the list of funds and note down in your spreadsheet the name of each sub-fund and the percent of investments it holds. Tip: Instead of entering the percent held in each fund as 63 percent, enter it as 0.63. This will make it easier to do calculations later. Also, make sure that the numbers in your percent column add up to one.
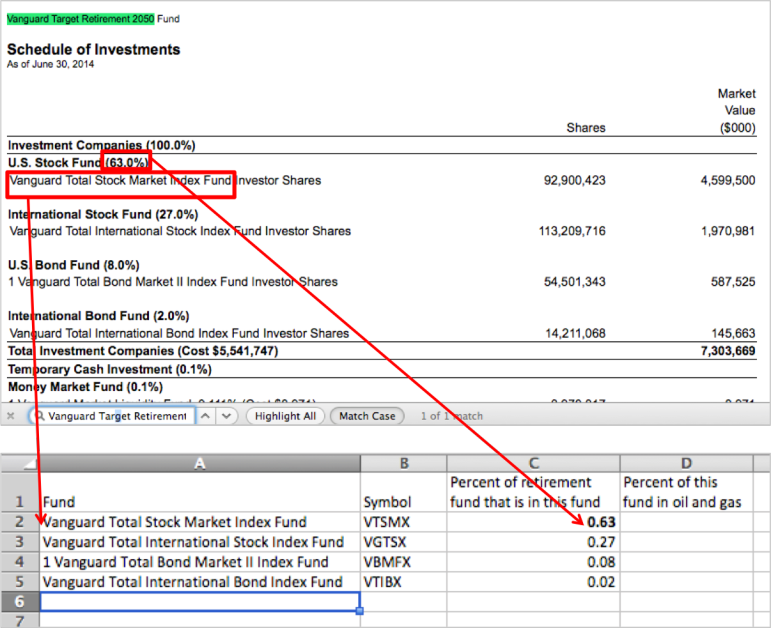
For this example, we are going to ignore, “1 Vanguard Market Liquitidity Fund, 0.111%”, a money market fund — because it is not heavily invested in oil and gas companies, and because it only represents 0.01 percent of the fund’s holdings.
Step 6: Find the stock ticker symbols for each of your sub-funds
Repeat step 2 for each sub-fund in your list and enter the stock symbol into your spreadsheet.
Step 7: Find each sub-fund’s N-Q on the SEC website
Next, repeat step 4 for each of your sub-funds. Is this starting to sound familiar?
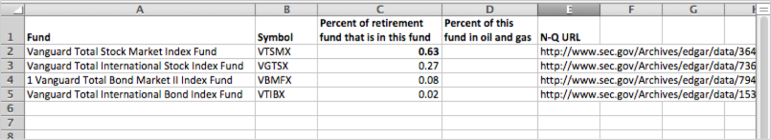
To make this process simple, you can keep track of the URLs for each N-Q in your spreadsheet, or keep them open in individual tabs in your web browser. Tip: An easy way to do this is to copy the URL from the top bar of your browser — using ctrl+C or command+C — and paste it into your spreadsheet using ctrl+V or command+V.
Step 8: Find out what portion of each sub-fund’s holdings are invested in oil and gas companies
Here’s where you get to do some detective work. Like in step 5, you will investigate the N-Qs to find out what each sub0fund is invested in — except this time you’ll be focusing on oil and gas.
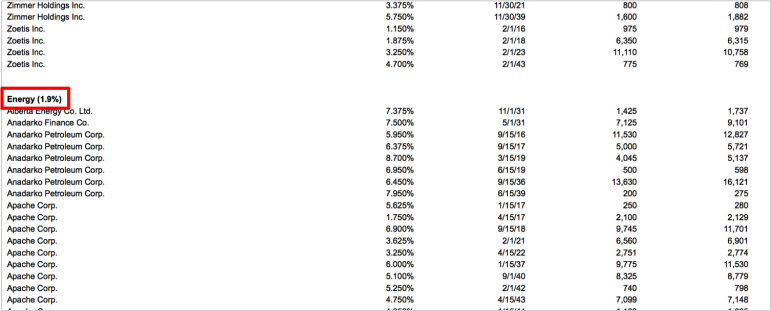
For some sub-funds, this will be easy. For example, the Vanguard Total Stock Market Index Fund, which accounts for 63 percent of our sample Vanguard retirement fund, has a section devoted to oil and gas (you have to scroll a bit, past other sectors like “Financials” and “Consumer Services,” but it’s there):
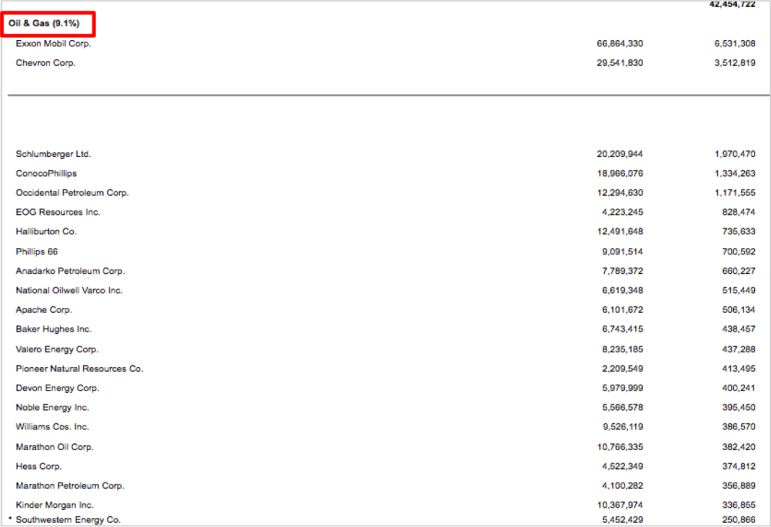
Record the percentage of the sub-fund that is in oil and gas companies, 9.1 percent in this case, in your spreadsheet. Remember, the hundreds of oil and gas companies the fund is invested in — everything from Exxon Mobil to Dril-Quip Inc. — are all publicly traded. Which means, if you wanted to, you could examine their financial statements through the SEC as well.
For other sub-funds, it won’t be as easy. For example, the next sub-fund on the list, Vanguard Total International Stock Index Fund, breaks investments out by country, not industry. There are nearly 6,000 companies listed in its N-Q, so going through each one and Googling it to figure out if it’s an oil and gas company isn’t realistic. Instead, we can compare the list — using an online comparison tool like this one or this one — to a list of the largest international oil and gas exploration and extraction companies. You can find one in the spreadsheet template or here. This isn’t a complete list, just a starting point.
For the sake of time, we’ll just look at the top 100 holdings for this sub-fund, which we can find at Vanguard’s website. Tip: There’s a lot of information at fund websites — check them out when you get stuck. Here are the oil and gas exploration companies for this fund:
- BG Group
- BHP Billiton
- BP
- HSBC Gas Holdings
- Royal Dutch Shell
- Total SA
- Canadian Natural Resources
- Eni
- Suncor Energy
For each of these companies, we can find out from the N-Q what percentage of this sub-fund’s money it accounts for, and from that, we can figure out what percentage of the 100 largest holdings are in oil and gas. In this case, 14.5 percent of the sub-fund’s top holdings are in oil and gas companies. We are going to extrapolate and apply that oil and gas investment rate of 14.5 percent to the entire sub-fund. Note that this is a short-cut: If you want to be completely thorough, you would have to go through each of the nearly 6,000 companies in this fund and determine which of them are in the oil and gas industry.
The next sub-fund, the Vanguard Total Bond Market II Index Fund, is organized a bit differently. It is entirely bonds, or debt, held by the U.S. Treasury, banks like JP Morgan Chase, and individual companies like Anadarko. If we scroll down far enough, we see that the N-Q has a section for energy bonds. In this case, nearly all of these companies are in oil and gas, so we are going to take the energy portion as the oil and gas portion.
Our final sub-fund, Total International Bond Index Fund, is organized similarly to the international sub-fund. Looking through the list of bonds, we can see that many of them are energy companies. However, because this fund is only two percent of our entire fund, and it has thousands of holdings, we are going to take another shortcut and assume that it is allocated in a similar fashion as the previous bond fund, which has 1.9 percent invested in energy. Sound lazy? Don’t worry — it won’t make a big difference in our overall analysis.
Step 9: Add all the sub-funds back together to get an overall oil and gas proportion
After all of our detective work, here is what your spreadsheet should resemble:
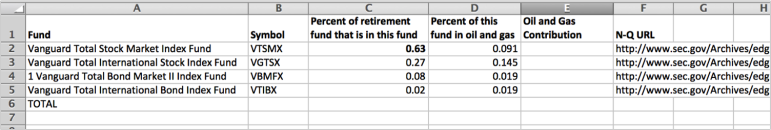
For each of your sub-funds, multiply the two columns (Percent of retirement fund that is in this sub-fund, and Percent of this sub-fund in oil and gas) together. For example, in cell E1 use the formula =C2*D2. Then add up all of those values to get the percent of your retirement fund that is invested in oil and gas. In cell E6, use the formula =SUM(E2:E5). The formula is also coded into the spreadsheet template.
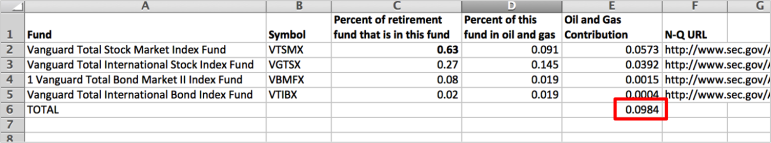
For the sample Vanguard Retirement 2050 Fund, 9.84 percent is directly invested in oil and gas companies.
To find out how much money you have directly invested in oil and gas, simply multiply this percentage by the value of your fund. For example, if you had $10,000 in this Vanguard fund, $984 of it would be directly invested in oil and gas companies.
What did you find? Share your analysis in the comments section below. Encounter any egregiously difficult financial documents? Share your stories with us. Have a suggestion for how to improve this guide? We’d love to hear that, too.