As more and more crude oil travels by rail, the number of railroad accidents involving oil are on the rise, Politico reports. But whether crude-by-rail’s safety record is actually getting worse remains an open question: Are crude-by-rail accidents growing faster than shipments, or are they simply keeping pace?
There are a few ways to measure the severity of an accident:
- fatalities and injuries
- monetary damages
- gallons of oil spilled.
Politico published the number of crude-by-rail incidents, by year, from the Pipeline and Hazardous Materials Safety Administration (PHMSA) database and the monetary damages (in dollars) of those incidents. So for now, we’ll focus our analysis on those metrics.
Here’s what the crude-by-rail incidents (accidents, derailments, spills, etc.) per year and damages per year look like on their own:
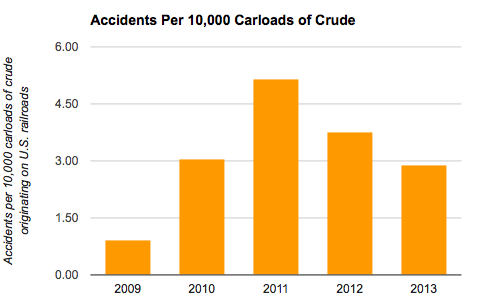
Data Source: PHMSA, as reported by Politico
There’s a clear rise, over the past five years, in both total incidents and monetary damages caused by those incidents.
But here’s what this same data looks like when you normalize for the increase in crude-by-rail shipments – that is, if you divide incidents and damages by the number of carloads of crude traveling on U.S. rails that year:
Data Sources: PHMSA, as reported by Politico; American Association of Railroads
Looking at the data this way, the rise in accidents isn’t as sharp and the trend isn’t as clear as reported by Politico.
The number of accidents per carload has been fluctuating and peaked in 2011, when there were more than five reported spills for every 10,000 carloads of oil. In the past three years, the number of spills per carload has actually being decreasing. Accidents per carload can be a deceptive metric, however, because some accidents result in no oil spilled, no deaths or injuries, and very little damages, whereas others are devastating.
Large, costly, dangerous spills make it hard to generalize about the overall safety record. In 2009, a single spill caused $770,000 in damages – more damages than the 88 accidents in 2012 combined – making it by far the most costly year at $71.03 per carload of oil. Damages were $2.03, $3.04 and $2.70 per carload in 2010, 2011 and 2012, and rose to $8.31 per carload of oil in 2013. Because the 2013 spill data is “unofficial” due to a contested spill near Aliceville, Alabama, it’s impossible to say if the rate of damages increased last year.
Of course, the number and severity of spills per carload of oil traveling on rails may ultimately be irrelevant. For people living in communities where oil rumbles by on a daily basis, there’s only one acceptable spill rate: zero.
Read More: “Accidents On The Rise As Crude-By-Rail Booms – Overall Safety Record Uncertain,” by Alisa Barba
Get the Data: Crude-by-rail shipments, incidents, damages, and rates by year, 2009 to 2014
Data Notes:
- Accident and damages numbers were pulled from this Politico story, which summarized incidents from the PHMSA database.
- There are many ways to estimate the number of crude oil cars moving on U.S. rails. For this post, we used American Association of Railroads numbers for originating U.S. carloads. We also did the analysis with numbers from the Surface Transportation Board and with terminating carloads. You can see the full analysis, and links to the source data, in this spreadsheet.
- For accidents per carload, we reported it as accidents per 10,000 carloads of oil to make the number easier to read.
(Editor’s note, 6/18/2014, 4:31 pm: An earlier version of this story incorrectly said there were five reported spills for every carload of oil in 2011. The correct figure is five spills for every 10,000 carloads.)